Next Monday, Phil Simon‘s sixth book, The Visual Organization, hits the shelves on Amazon. Last year, Simon told companies they needed big data with his book Too Big to Ignore; now, he’s telling them what to do with it – namely, visualize it.
We’re not talking infographics here; we’re talking about turning tools and data into insights about your customers, your employees, and the future of your business.
Simon is the author of five other management books, including The Age of the Platform. He currently works with companies to optimize their use of technology. Below, he explains why your startup needs to become a visual organization and how to get started.
Tech Cocktail: Why do startups need to become Visual Organizations? What are the benefits?
Phil Simon: As I write in The Visual Organization, these days, startups abound all across the globe. Thanks to the Lean Startup Movement, open-source software, open APIs, SDKs, GitHub, AWS, and the like, it’s never been easier or less expensive to start a company.
This is concurrently positive and negative. With respect to the latter, it’s not terribly difficult to ape just about any product or service. For relatively small amounts of money (compared to years past), a startup can more or less mimic another’s raison d’être and even specific functionality. Design can be copied – and often is.
Against that backdrop, two things can separate one startup from another:
- Number/quality of its customers/users
- The data that the startup or app collects
As Amazon, Apple, Facebook, Google, Netflix, and Twitter have shown, data is increasingly a source of sustainable competitive advantage. If you really understand the data that your company is generating, then you may very well be able to increase your user/customer base. But how do you start when faced with vast amounts of largely unstructured data? In the book, I describe contemporary dataviz tools that are helping employees, groups, VCs, angels, and customers understand large swaths of data. As a result, they can identify trends, make better business decisions, and possibly predict what will happen next.
Tech Cocktail: Speaking of tools, what are the top five data visualization applications that startups should consider using?
Phil Simon: In no particular order, they should consider:
This is anything but a comprehensive list. (The book contains a more robust index of tools.) Of course, a mindset predicated on data discovery is the most important thing. Becoming a Visual Organization is not simply a matter of purchasing best-of-breed tools.
Tech Cocktail: How do companies start? What are the different steps?
Phil Simon: Well, there’s no ten-point checklist. I fancy myself an author of big-idea books. If pressed, though, I’d recommend that they start by buying the book!
Second, recognize that Big Data is not the sole purview of large companies like Amazon, Apple, Netflix, GE, Facebook, and Google. Small businesses and startups can take advantage of the data deluge. In the book, I profile Wedgies, a six-person Vegas startup building a big-data-friendly company. Remember that you don’t go from zero to Google overnight, though.
Next, realize that visualizing data for the sake of doing so makes no sense. Your organization needs to act on new insights and information. Paying lip service to Big Data and dataviz is ultimately counterproductive.
It’s imperative to understand the potential value of data. Jim Barksdale once famously said, “If we have data, let’s look at data. If all we have are opinions, let’s go with mine.” That mindset is growing. In fact, many people believe that data is the new oil. I partially agree with that sentiment. Like oil, data must be refined. (Unlike data, oil is a rapidly dwindling resource. They’re not making any more.)
Finally, recognize that it’s a journey, not a sprint. The days of “set it and forget” are over.
Tech Cocktail: What are the biggest mistakes companies make when trying to visualize data?
Phil Simon: There are a bunch, but I’ll focus on three data atrocities here. Many don’t start until they have “all of the data.” Plenty of them only visualize “good” data, when in fact a dataviz can easily manifest outliers and problematic issues. Others rely exclusively on Microsoft Excel and other stalwarts. Excel is great, but it’s hardly the only game in town. More important, it simply can’t handle petabytes of unstructured data.
Tech Cocktail: How have you personally used dataviz in your life?
Phil Simon: In my consulting days, I created a slew of reports and dashboards for my clients, many of which contained visual elements.
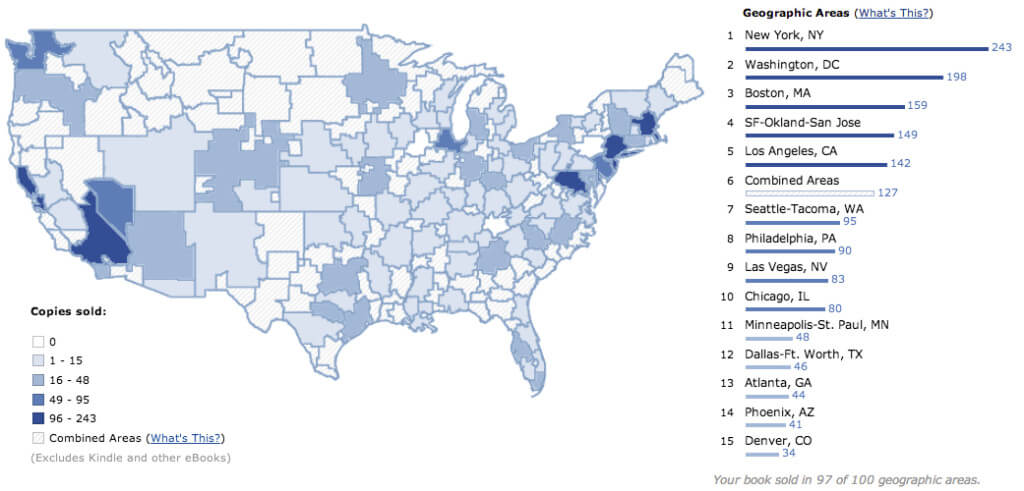
I honestly wish that I could do more. Lamentably, Amazon doesn’t make individual customer sales data available to its authors. I’d have a field day with that data, rest assured! Amazon heat maps are pretty interesting:

I can then tailor my Google AdWords’ campaigns to specific areas like Seattle and New York.
Beyond that, I routinely look at my website traffic numbers on WordPress and Google Analytics to attempt to understand my readers. I’ve created simple models for my forays into fantasy sports.
For more, check out “The Visual Organization” on Amazon or watch the trailer here.
